
For TradingView Strategy Tester exports
See exactly when your strategy makes money
— and whether that edge lasts
Upload your TradingView backtest export and get the analysis the built-in report doesn't show: profitability by entry hour with rolling-window stability scores, side-by-side strategy comparison, and 30+ risk metrics — in about 30 seconds.
Free tier · No credit card required · or try the instant report — no signup
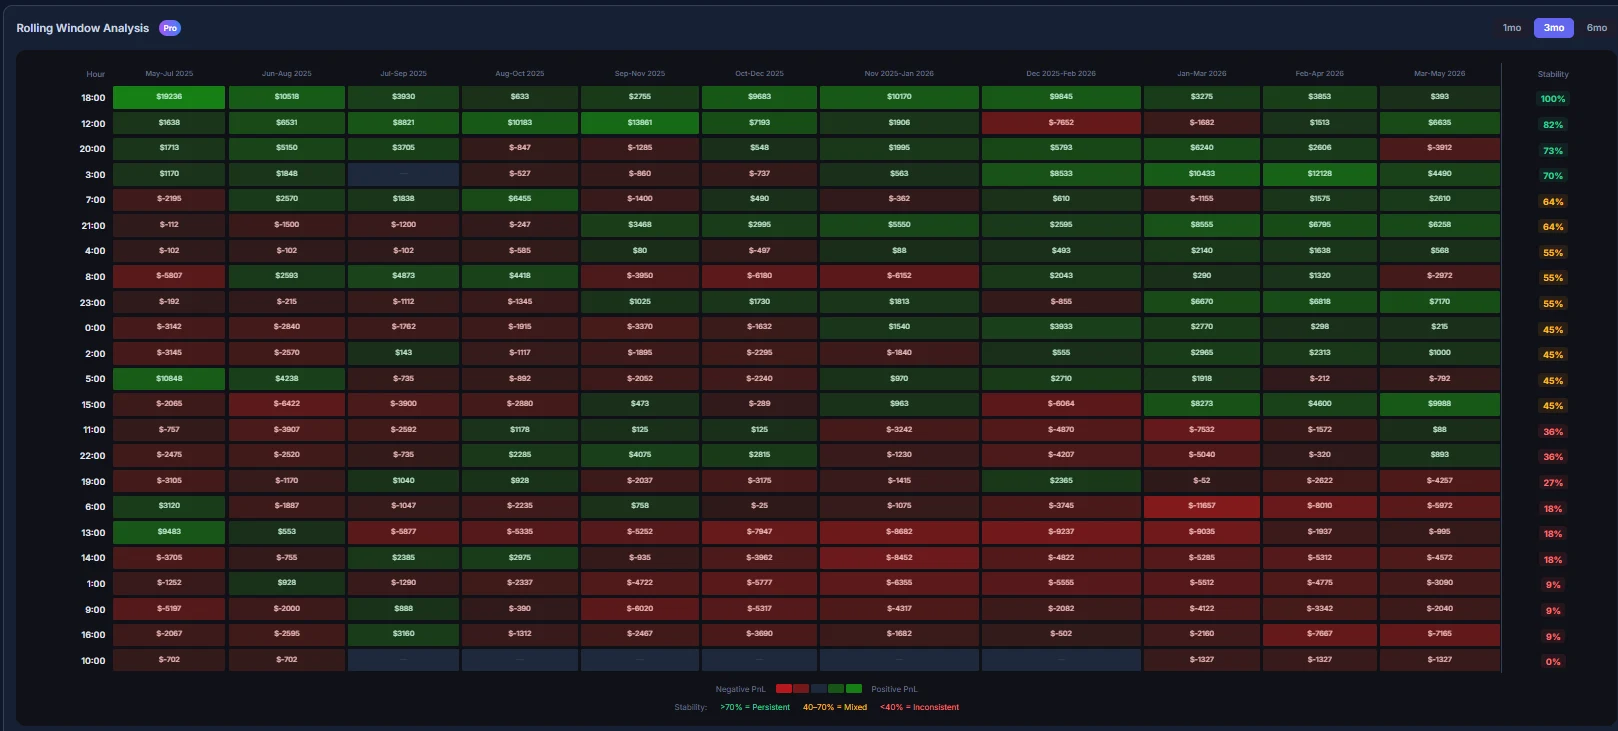
Rolling Window Analysis: every entry hour ranked by how consistently it was profitable, not just how much.
From export to insight in three steps
Export from TradingView
Run your strategy in the Strategy Tester and export the results as .xlsx — works on any TradingView plan.
Drag & drop upload
Automatic deduplication keeps your data clean, even across overlapping exports. Open positions are detected and separated.
Analyze & compare
Interactive charts, hour-by-hour breakdowns, and full risk metrics — for one strategy or several at once.
Find persistent patterns
An edge that only worked one month isn't an edge
Anyone can show you a heatmap of past profits. DataViz Studio shows you whether the pattern held up month after month. Each entry hour is scored with a Stability % across rolling windows — so you can tell a persistent pattern from a one-month coincidence.
- 24-hour × rolling-window heatmap (1, 3, or 6-month windows)
- Hours ranked by Stability %: persistent, mixed, or inconsistent
- Hour-filter scenarios with equity curves, profit factor, and win rate per scenario
Compare variants honestly
Every strategy variant on one chart, one axis, one verdict
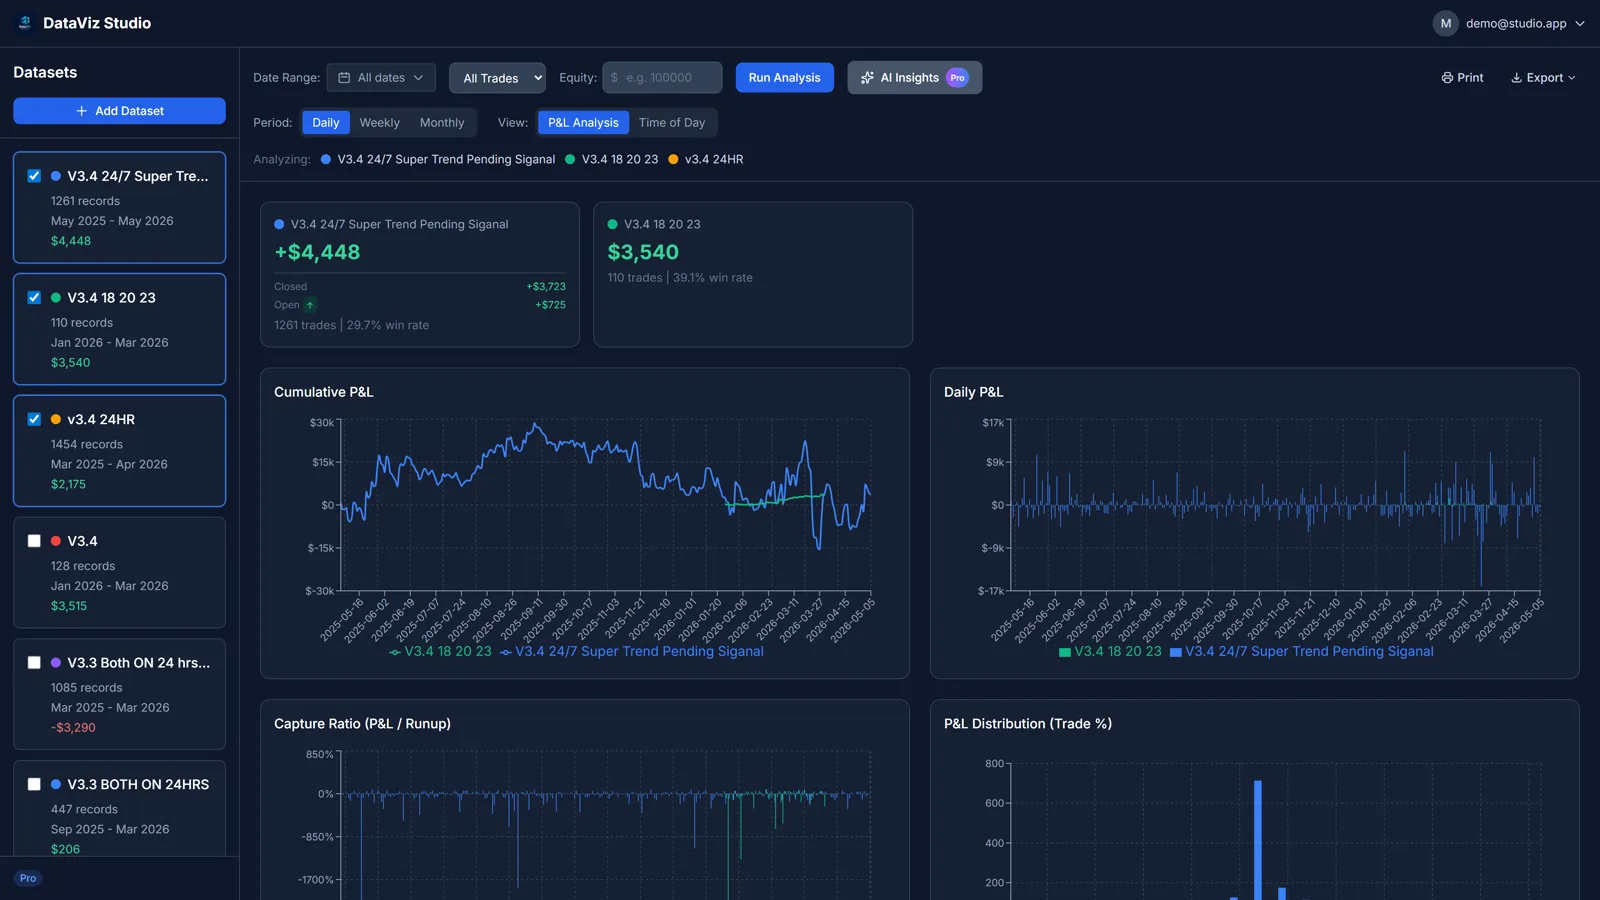
Testing V3.1 against V3.4? Long-only against both directions? Select any of your datasets and every chart overlays them on a unified time axis, with risk metrics side by side — no more flipping between Strategy Tester tabs and eyeballing.
- Overlaid cumulative P&L, period P&L, and distribution charts
- Risk metrics matrix: every strategy in adjacent columns
- Shared date-range and direction filters across all selections
Institutional-depth metrics
30+ risk metrics the Strategy Tester doesn't compute
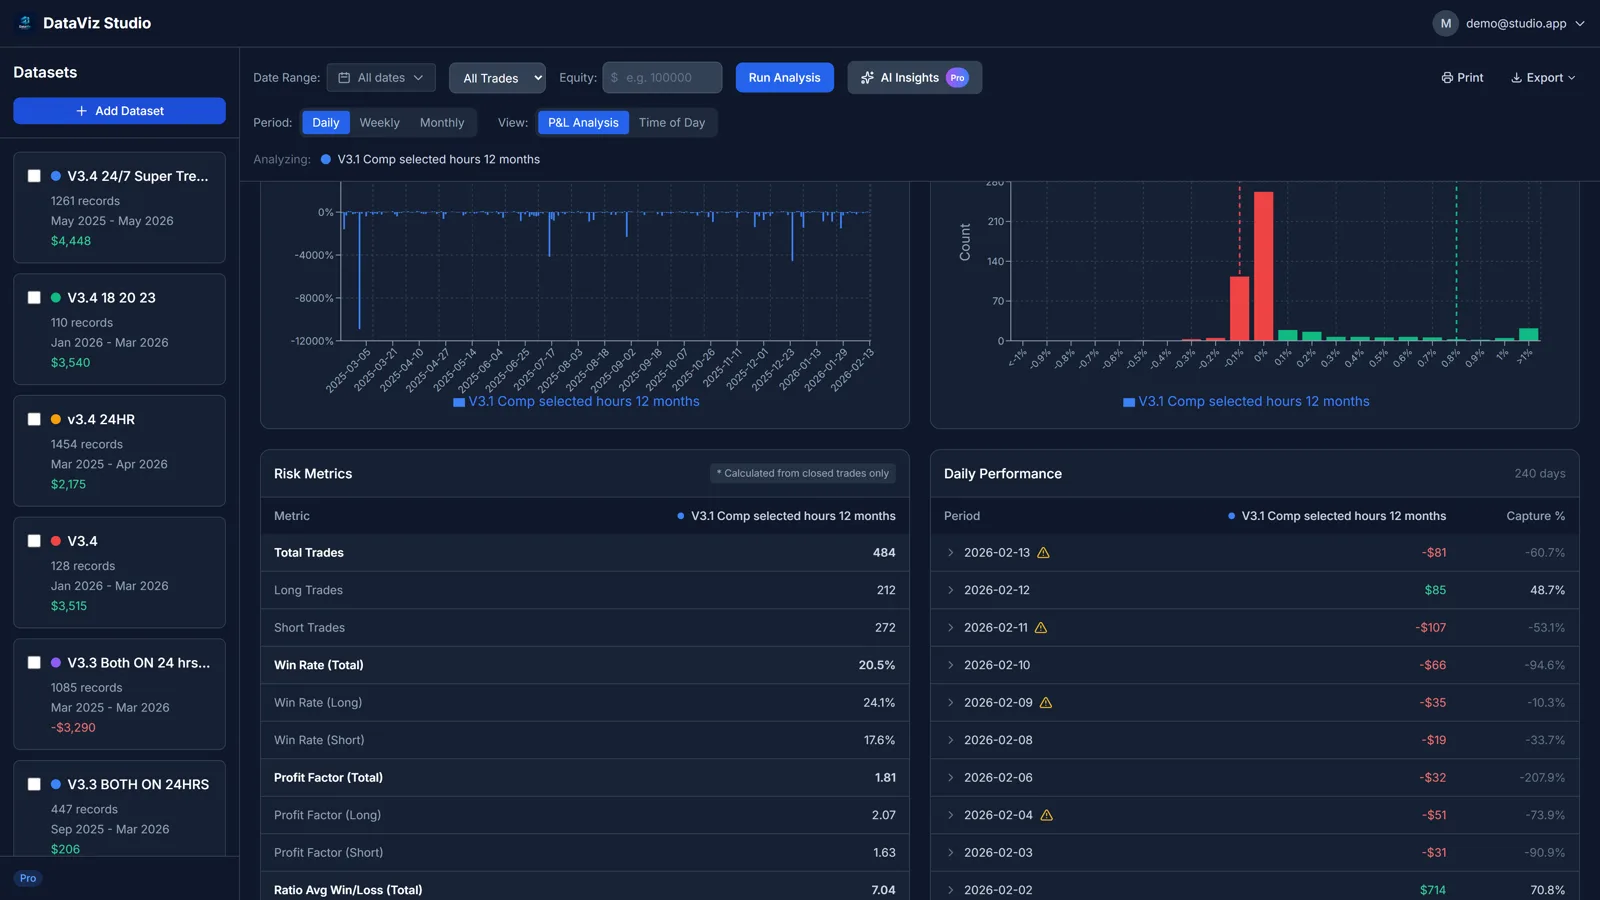
Annualized Sharpe and Sortino, max drawdown with recovery dates, capture ratio by direction, and giveback alerts that flag trades where large open profits turned into losses — each metric split across all / long / short.
- Sharpe & Sortino ratios (annualized)
- Max drawdown with duration and recovery status
- Capture ratio drilldown and self-calibrating giveback alerts
- Open positions detected and excluded from closed-trade metrics
AI-generated study
A written statistical summary of every dataset
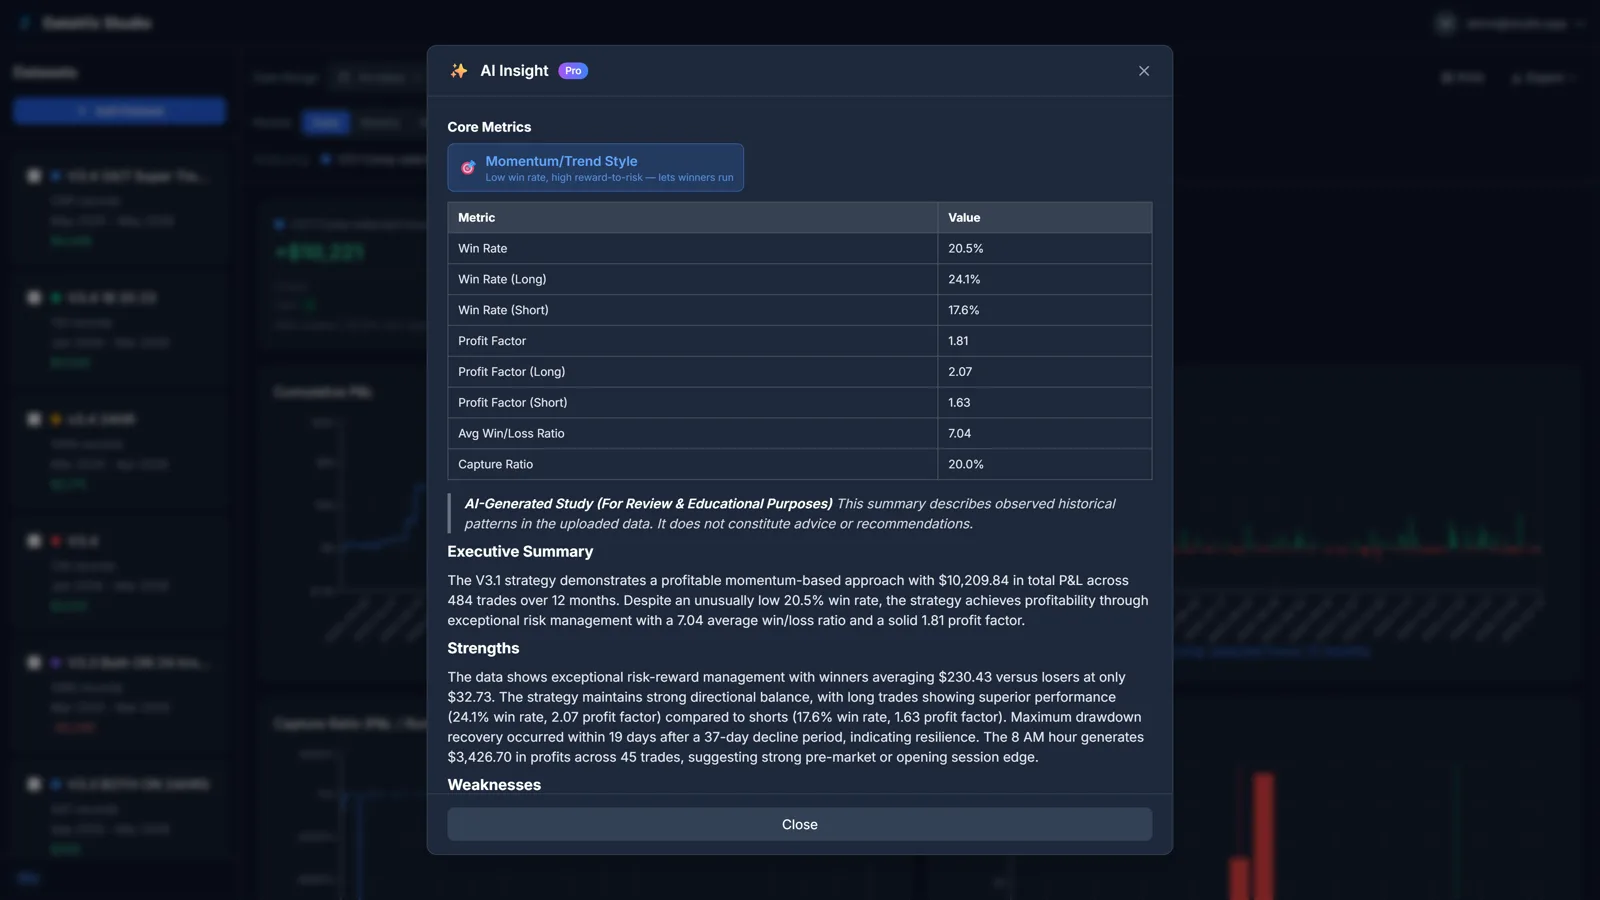
AI Insights reads your pre-computed metrics and writes a plain-English study: strategy style classification (momentum / mean-reversion / hybrid), strengths, weaknesses, and comparative analysis when multiple datasets are selected. Descriptive statistics only — never advice or signals.
- Style classification with context-aware interpretation
- Comparative analysis across selected datasets
- All numbers computed deterministically — AI only explains them
Beyond the built-in Strategy Tester report
TradingView tells you whether your strategy made money. DataViz Studio tells you when, how reliably, and compared to what.
| Analysis | Strategy Tester report | DataViz Studio |
|---|---|---|
| Net profit, win rate, profit factor | ||
| Equity curve & drawdown | ||
| Profitability by entry hour (0–23) | ||
| Rolling-window stability % per hour | ||
| Multiple strategies side by side on one axis | ||
| Sharpe & Sortino (annualized) | ||
| Capture ratio & giveback alerts | ||
| AI-generated statistical summary | ||
| PDF / Excel reports |
Based on the standard TradingView Strategy Tester report as of 2026. TradingView is a trademark of TradingView, Inc. DataViz Studio is an independent product, not affiliated with or endorsed by TradingView.
Simple Pricing
Start free, upgrade when you need more
Free
$0/month
- 2 active datasets
- Analyze up to 1,000 records
- Core charts & risk metrics
- Time-of-day P&L chart
- CSV export
- No credit card required
Plus
$9/month
For focused single-strategy work
- 5 active datasets
- 10,000 records/month
- Everything in Free
- Active Window Analysis (hour-filter scenarios)
- PDF export & print
Free for 7 days, then $9/month
Pro
$19/month
Founder pricing — locked in forever
- 20 active datasets
- 50,000 records/month
- Everything in Plus
- Rolling Window heatmap with Stability %
- Multi-dataset comparison
- AI-powered insights
- Capture Rate drilldown & giveback alerts
- Excel export
- Priority support
Free for 7 days, then $19/month — cancel anytime with one click via Gumroad
Record count is cumulative. Deleting files does not reset usage.
Frequently asked questions
What file formats can I upload?
Excel (.xlsx) exports from the TradingView Strategy Tester — the standard export you get from the "Export data" button in the Strategy Tester panel. Uploads are deduplicated automatically, so re-uploading overlapping date ranges never creates duplicate records.
Does DataViz Studio give trading advice or signals?
No. DataViz Studio is a statistical analysis tool. It summarizes and visualizes the historical data you upload. It does not provide financial advice, trading signals, or recommendations of any kind.
Is my data private?
Yes. Your uploads are stored in your account only, protected by row-level security — no other user can ever see your data. We never share or sell your data.
What is Stability % in the Rolling Window heatmap?
For each entry hour, we slice your history into rolling windows (1, 3, or 6 months) and measure how consistently that hour was profitable across windows. An hour that was profitable in 9 of 10 windows scores 90% — a persistent pattern. An hour that made all its money in one lucky month scores low, no matter how big the total.
Can I cancel anytime?
Yes. Pro is a monthly subscription managed through Gumroad — cancel with one click, no questions asked. Your data stays accessible on the Free tier limits.
Your next backtest deserves a better report
Upload your first TradingView export free and see your strategy's hour-by-hour profile in about 30 seconds.
Analyze Your Backtest Free